Australian Government Censors Its Own Infographic After…
Australian Data Proves China’s Pandemic Response Success
20 June 2020: In a high-profile speech four days ago, Australia’s foreign minister, Marise Payne accused China of spreading “disinformation” around COVID-19. In particular, the right-wing senator asserted that Australia had been “very clear in rejecting as disinformation the Chinese government’s warnings that tourists and students should reconsider coming here because of the risk of racism.” The conservative Morrison government has clearly been stung by the warnings about travel to Australia that China had very understandably given to its tourists and students. The travel warnings resulted from a frightening surge in the already large number of racist attacks taking place in Australia against people of Chinese background and other people of East Asian appearance.
In a further attack aimed against China, Payne claimed that it was “troubling that some countries are using the pandemic to undermine liberal democracy and promote their own, more authoritarian models” and boasted that Australia would resist and counter efforts at disinformation “through facts and transparency.” So let us do some examination at who has been “transparent” and who has been “spreading disinformation” during the COVID-19 outbreak.
Those Conspiracy Theories About China’s COVID-19 Numbers
The most contentious issue when it comes to “disinformation” around COVID-19 is the claim by the likes of that master of disinformation, Donald Trump that China’s infection numbers are grossly downplayed. Right wing shock jocks in Australia have peddled a similar line. In the course of the witch-hunt that they helped propel against NSW Labor upper house MP, Shaoquett Moselmane, for stating that the PRC had taken effective countermeasures that had contained the COVID-19 threat, 2GB radio’s Ray Hadley and Sky News presenter, Peta Credlin, put out claims that the real death toll in China is actually around 40,000 and that the number of infected people there is more than ten times higher than reported. More “centrist” media have also claimed that China has under-reported the virus impact without providing any estimate of what they think the real number of infections and deaths there are. None of those putting forward such conspiracy theories have actually provided any evidence to back their claims.
Now there has been under-reporting of deaths in some countries. The U.S. top infectious disease official, Dr. Anthony Fauci, admitted at a Senate hearing on May 12 that the U.S. death count is almost certainly higher than reported [4]. Not all of this is because of conscious under-reporting. Many people are not counted in official U.S. figures because they died before they were positively identified with the coronavirus. Especially when health systems are overwhelmed such under-reporting is possible. After China had largely suppressed the virus threat in mid-April, the authorities there did a detailed investigation of the death toll by comparing figures from hospitals, funeral sites and public health agencies. They increased the death toll figure by 38% after accounting for people who had died at home during the initial surge in the outbreak when the hospital system was stretched, deaths not recorded by overwhelmed medical staff during that period who were focused instead on saving patients and deaths missed because of some hospitals not having been linked to the central recording site.
In the U.S., as well as unintentional under-reporting there have also been cases of deliberate under-reporting. Some of this is in states like Florida, Georgia and Arizona that have been recklessly re-opening businesses even as the virus runs rampant. Governments have sought to downplay new virus cases in order to justify the re-opening. The authorities have even driven out public health officials who have refused orders to manipulate data [5], [6]. There have been credible estimates that the real U.S. death toll is up to 50% higher than officially reported – both due to innocent under-reporting and deliberate under-reporting – and in some local areas the actual death toll may be as much as twice what is officially reported. However, to suggest that any country, including China, could get way with reporting a pandemic death toll more than ten times lower than the actual numbers is plainly bonkers. This is especially the case once a country gets the upper hand on the virus spread, which is now the case in China. Social distancing measures are eased and people again re-connect with family, social networks and work colleagues. In that situation no modern country could get away with under-reporting a death toll by a factor of ten. This particularly applies to densely populated, urban societies where populations are more interlinked and what happens in one neighbourhood is quickly known in other adjacent neighbourhoods. Wuhan, where most of the deaths in China occurred, definitely is such a society. Moreover, this is true more so for China, with its collectivist, more community-connected society, than for the more individualistic U.S. and Australia. People in China tend to be closely linked to each other through neighbourhood collectives, community organisations and a social workplace culture. This includes the elderly, the section of society hardest hit by the pandemic, who in China are known for joining together in mass social activities like group tai-chi sessions and even late-night, street dance parties. Where people have strong social ties to each other, it is simply impossible for any government to cover up deaths from a disease outbreak to the degree suggested by the conspiracy theorists, even if a government wanted to.
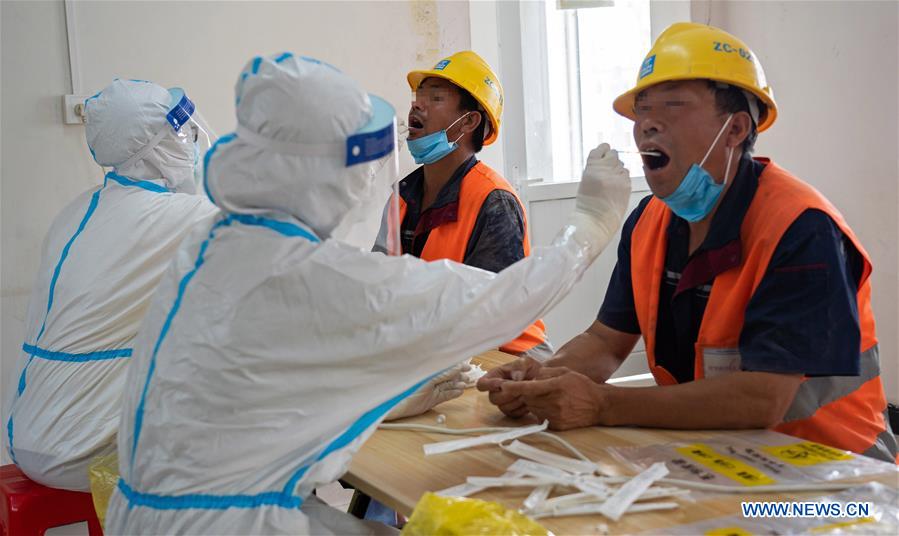
Fortunately, we can actually evaluate those claims that China has massively downplayed the extent of its coronavirus outbreak by looking at the Australian government’s own figures. The first figure to consider is the number of people who were found to have the coronavirus out of the Australian citizens and permanent residents brought out of Wuhan into quarantine in Australia in those “evacuation” flights. The first two groups of 278 Australian residents (242 + 36) brought out of Wuhan in chartered flights organised by the Australian government were cruelly required to endure their quarantine at the Australian regime’s remote Christmas Island immigration prison from the start of February [7]. The other group of 266 Australian residents flown out of Wuhan were quarantined at a facility in Darwin from February 9 [8]. Given that these groups, numbering a total of 544 people, were brought out of the city that is universally acknowledged to have been the hardest hit part of China and given that they flew out of Wuhan when the virus spread was at its most rampant there, one would expect that a large number of these people would test positive for COVID-19 if the conspiracy “theories” about the scale of the virus impact in China are true. On his April 2 morning show on 2GB, radio shock jock, Ray Hadley, claimed that the real number of infected people in Wuhan is actually over 800,000 [9]. Given that Wuhan has a population of 11 million, Hadley’s claim is equivalent to saying that over 7.3% of Wuhan’s population became infected. If that were true, we would then expect on probability that at least 40 of the 544 people brought out of Wuhan by the Australian government would be found by Australian health authorities to have COVID-19. But guess how many of these people ended up being found to have COVID-19? None at all! That’s right: a big fat zero [10] [11] [12]. Now this should be contrasted with the infection rate of the much smaller group of 164 Australians evacuated from the Diamond Princess cruise ship moored off Japan and moved into quarantine in Darwin on February 20 [13]. Despite all the Australians aboard the cruise ship already found to have the virus being transferred into isolation wards in Japan [14] and those at the last minute found to be infected also stopped from boarding the evacuation flight [15], ten of the 164 Diamond Princess evacuees still tested positive for the virus while in quarantine [16].

Photo Credit: Nic Ellis/The West Australian
Determining Infection Rates Based on
Screening Tens of Thousands of Arrivals from China
Now, a person rationally examining the fact that none of the 544 Australians removed from what was by far the worst hit part of China (Wuhan) at the very height of her coronavirus outbreak were found to have COVID-19, would say that this is indeed strong evidence that the virus outbreak in China is no worse than China reported but then say, show me some more numbers with a bigger sample size just to be sure. Indeed, we can do just this. On the second last day of February, Australia’s Deputy Chief Medical Officer, Professor Paul Kelly, provided the following information in a radio interview on ABC Radio National [17]:
“We’ve done a lot of testing as people have come from China into Australia. Over 40,000 people have arrived – Australians have arrived since the 1st February – not a single one of those have proved to be positive for the virus.”
Now this is very telling! Over 40,000 Australian citizens and permanent residents entered Australia from China during basically the worst four weeks of China’s outbreak (i.e. in February) and not a single one of them tested positive for the coronavirus. Now to put that in perspective, in roughly the four worst weeks, thus far, of Australia’s outbreak the number of infections rose from just under 300 on March 16 [18] to 6313 on April 12 [19]. That’s more than 6,013 infection in four weeks out of a total Australian population of 25.4 million. So in that four week period, we would expect that for every 40,000 Australian residents, on average, ten would test positive for COVID-19. Yet out of the 40,000 people who arrived from China during the worst four weeks of her outbreak, none at all tested positive for COVID-19! In other words, the Australian government’s own figures confirm that the virus spread in China during the most severe period of her outbreak was significantly less than in Australia during the peak of the outbreak here.

Now 40,000 people is a very large sample size on which to base the above conclusion. But we can examine the infection rate among a still bigger number of people arriving from China. We can, in fact, look at the number of infections amongst all the people who have arrived into Australia from China in the first four months of this year. The Australian government’s Department of Health records the number of COVID-19 cases coming from various regions and the government’s Australian Bureau of Statistics records the number of residents and visitors arriving in Australia every month from each separate overseas country. By dividing the number of people infected with COVID-19 who have arrived in Australia from China by the number of arrivals from China we can get a sense of China’s infection rate. This number can then be compared with China’s official infection rate. We must say from the outset, however, that the infection rate that we obtain from Australian government figures may be somewhat of an over-estimate of the real infection rate in China. This is because a disproportionately high amount of the people entering Australia from China (that is Australian Chinese households returning from visits to family in China, Chinese international students studying in Australia, Australians returning from study and work in China and Australians who tour China) return from travel or residency in China’s cities rather than from her rural areas. Yet it is in China’s cities (in most parts of the world, including Australia, urban areas have been hardest hit by the virus) where the virus impacted far more greatly that in the less densely populated rural areas.
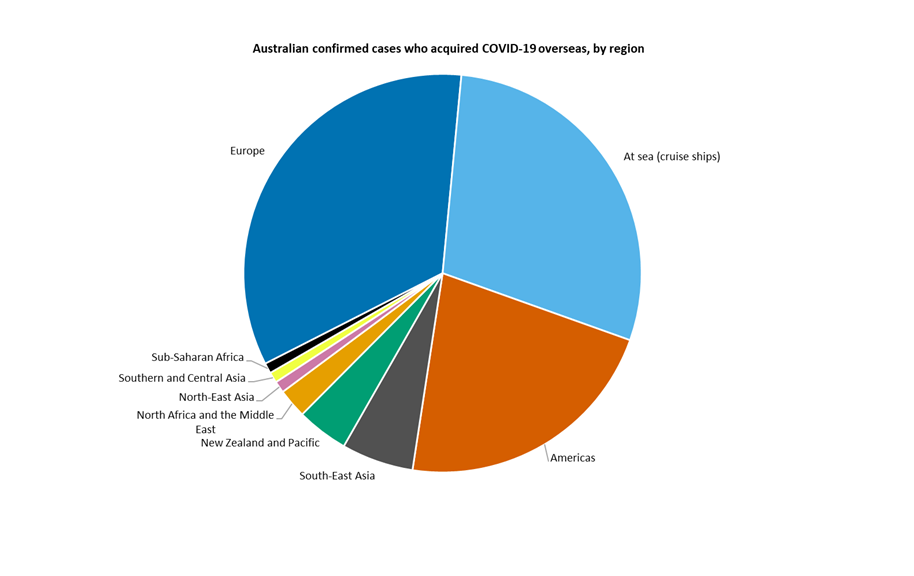
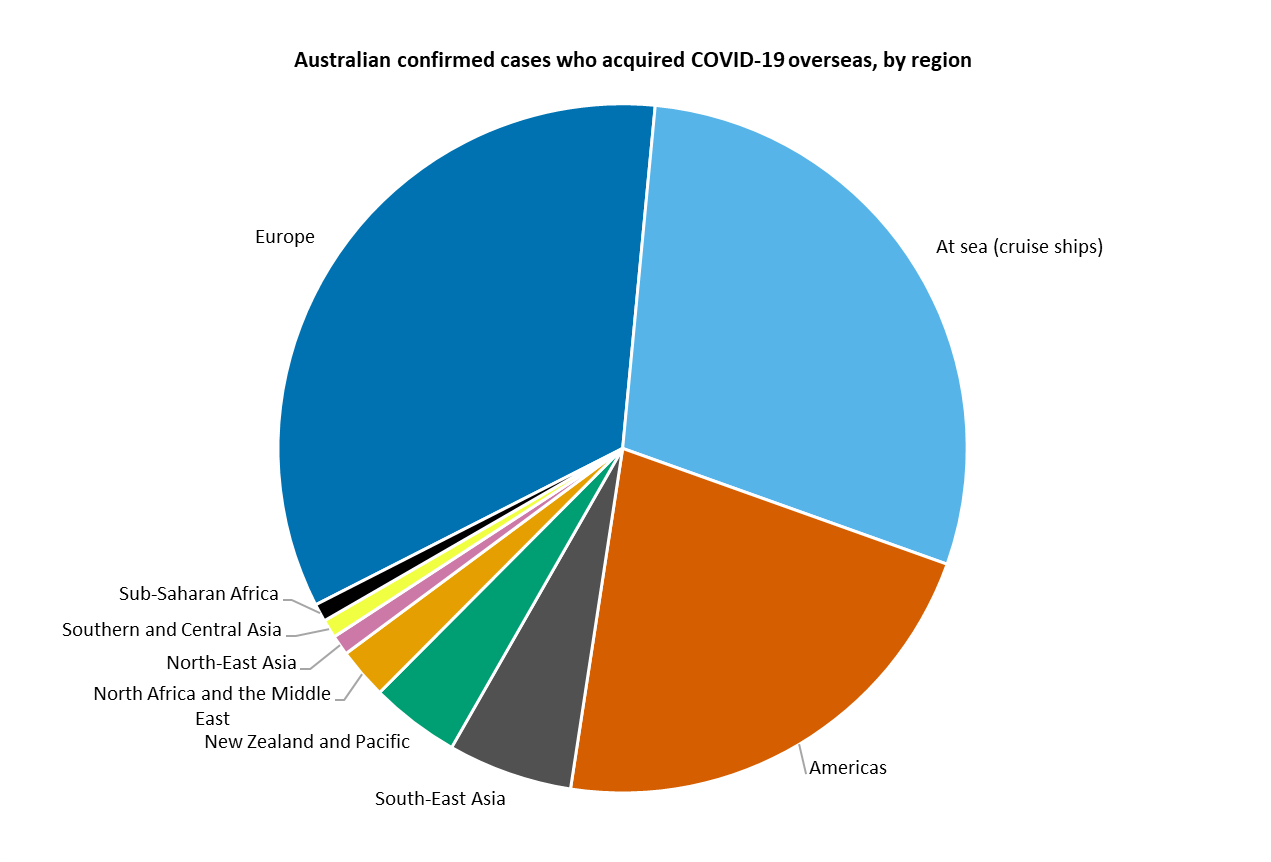
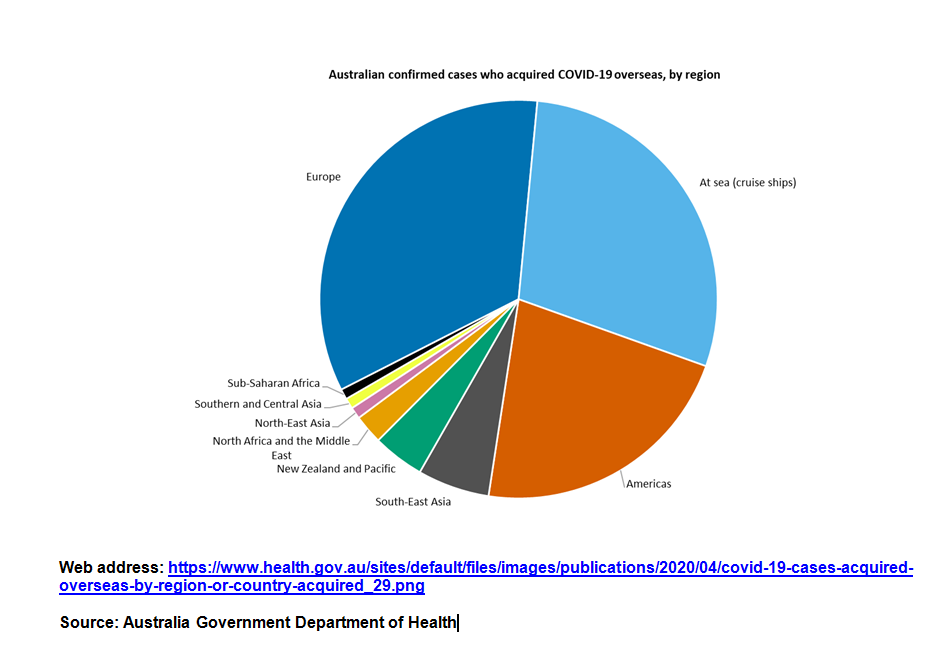
To get an estimate of the number of people infected with COVID-19 who entered Australia from China we need to look at the pie chart that the Australian government’s Department of Health had been publishing daily on its website titled, “Australian confirmed cases who acquired COVID-19 overseas, by region.” Mysteriously, after April 30, the Australian government not only stopped publishing this chart on its Department of Health website but then made the existing data basically impossible to find online (we will have more to say on this). Fortunately, we saved the practically impossible to find link that contains the data. Here is the link: https://www.health.gov.au/sites/default/files/images/publications/2020/04/covid-19-cases-acquired-overseas-by-region-or-country-acquired_29.png [20] (hopefully the link still works by the time that you read this article but we will re-print the screenshot of the chart as well just in case). Examine this chart using an angle measuring instrument (protractor) and you will see that this Australian government chart shows that just a tiny 0.83% of all COVID-19 cases in Australia that were acquired overseas were infected with the virus in the North-East Asian region that includes China (as the chart shows the overwhelming majority of overseas acquired cases actually came from Europe, America and cruise ships). Now researching the Australian government’s “Coronavirus (COVID-19) at a glance infographic’, still published daily, for April 30 shows that up to that date, 63.6% of the total 6753 virus cases in Australia at the time were acquired overseas [21]. That means that up to 30 April, 4295 of Australia’s COVID-19 cases in total were acquired overseas. Given that the pie chart shows that 0.83% of these cases were acquired in the North East Asian region, this means that the Australian government’s own figures show that just 36 of the overseas acquired COVID-19 cases came from the region that includes China.
Unfortunately, the Australian government has not published the break down in case numbers originating from the various countries in North-East Asia. However, examining media reports in the earlier period of the outbreak when China was hard hit, we find that 15 people entered Australia from China that were later found to be COVID-19 positive. So 15 is the minimum number of cases that entered from China. But what is the maximum possible number of people who entered from China who had acquired the virus while there? To obtain this upper limit, we need to deduct from the figure of 36 – that is, the total number of people who contracted COVID-19 in the entire North-East Asian region – those that are known to have contracted the virus in the North-East Asian places other than in mainland China: that is in Korea, Japan, Taiwan, Mongolia, Macao and Hong Kong. Looking at the individual media reports about new cases from the first period of the outbreak in Australia, we find that in total at least five people later found to have coronavirus entered Australia from North-East Asian places outside the mainland PRC: that includes a person who arrived from South Korea and a person who arrived from Japan who were both announced to have the virus on March 3 [22], a 58 year-old man who arrived in South Australia from Taiwan on March 3 [23] and a woman in her 40s returning from South Korea and a man in his 20s returning from Hong Kong who were announced to have COVID-19 on March 10 [24]. As the number of infected people in Australia rose, from after about March 10 media stopped reporting on the sources of individual cases originating from overseas. However, the NSW Government’s Health website details air flights where passengers later found to be carrying COVID-19 had travelled on (as part of attempts to trace those sitting close to the infected passengers). Examining this data for cases after March 10 we find that a further, at least, ten people infected with COVID-19 entered Australia from flights originating from North East Asian countries other than China and which flew non-stop into Australia [25] [26]: this includes five people arriving from Japan on flights arriving between 22 March and 13 April, four people arriving from Hong Kong between 12 March and 23 March and one person arriving from Taiwan on 17 March. That means in total at least 15 (5 + 10) of the 36 people with COVID-19 who entered Australia from the North-East Asian region travelled from countries outside the mainland PRC. Unfortunately, other state government health websites, unlike the one for NSW Health, no longer show data for earlier flights where passengers later found to be infected with COVID-19 had travelled on. However, if we assume that, other than for the 15 coronavirus-infected people confirmed to have come from Taiwan, Hong Kong, South Korea and Japan, all the remaining of the 36 cases who entered Australia from North-East Asia came from the mainland PRC, then at the very most just 21 people who entered Australia from mainland China had COVID-19. Put another way, based on Australian federal and state government data, one can ascertain that the number of people from the mainland PRC who entered Australia with COVID-19 in the first four months of this year is between 15 and 21.
To finally determine the infection rate of people entering Australia from China we now just need to ascertain the total number of people who entered Australia from China in the period from the time that the epidemic broke out at the start of this year until the end of April (which is the date up to which we have Australian data for the source countries of COVID-19 cases originating from overseas). We know that up to the end of January, both Chinese citizens (including international students, workers and tourists) as well as Australian citizens and permanent residents were able to enter Australia from China. After the Morrison government instituted its China travel ban, Australian permanent residents and citizens were still able to return here from China as well as a small number of Chinese citizens (and other foreign citizens arriving from China) arriving as special exemptions. Now Australian Bureau of Statistics figures show that up to the end of April, a total of 322,510 people – including both Australian and foreign residents – entered Australia this year from mainland China. This includes 205,930 visitors who entered Australia from mainland China (156,610 in January, 21,330 in February, 27,940 in March and 50 in April [27]) and 116,580 Australian residents who returned to Australia from mainland China (72,530 in January, 40,000 in February, 3,670 in March and 380 in April [28]).
If we now divide the number of people who entered Australia with COVID-19 from China, which as we have detailed is between 15 and 21, by this total number of arrivals from China of 322,510 we get an infection rate of people entering Australia from China, based on Australian government data, of between 0.0047% and 0.0065% or between 47 and 65 COVID-19 cases per million people. If we take the average of this range, we find that the infection rate of people entering Australia from mainland China, based on Australian government data, is approximately 56 cases per million people. This is actually slightly lower than China’s infection rate given by the Chinese government of 58 cases per million people. Moreover this calculated infection rate, based on Australian government data, of the arrivals into Australia from China, which is in turn an indication of the overall infection rate within China itself, is three and a half times lower than the number of actively infected people in Australia at the peak of its outbreak (which was 194 active cases per million people on April 4 – from 4935 active cases [29] divided by a 25.4 million population). This confirms just how effectively China has combated the virus threat. It also proves that contrary to the fears incited by Far Right racists, people entering Australia from China have been much less likely to be infected with COVID-19 than other people living here!
Now let us do exactly the same calculation based on Australian government data for people entering Australia from Europe and from America. The Department of Health’s pie chart [20] shows that up to 30 April a whopping 34% of the overseas acquired COVID-19 cases came from Europe and 22% came from the Americas. We find now that the infection rate of people entering Australia from Europe has been 2,966 COVID-19 cases per million people. The infection rate of people entering Australia from the Americas is 1,548 COVID-19 cases per million people (and if the Australian government provided data for infected people entering specifically from the U.S. the infection rate of people entering from just the U.S. would surely be found to be even higher than this). To put all this in perspective this means that, Australian government data shows that the infection rate of people who entered Australia from Europe in the first four months of this year was 53 times higher than the rate of infection of people entering from China in that period, while the infection rate of people entering Australia from the Americas in the first four months of this year was 28 times higher than the infection rate of people entering Australia from China in that period.
The above contrast between the infection rate of arrivals from, on the one hand, China and, on the other, Europe and America is actually understated because until well into March, people entering Australia from Europe and America were not screened for COVID-19 and were not even told to consult their doctor if they had symptoms – only those who arrived from China, South Korea and Iran were [22]. That meant that many infected people who entered from the U.S. and Europe were not detected as having the virus. Moreover, while new cases in China are now down to barely a trickle relative to her huge population, the pandemic has continued to spread rapidly in Europe and the Americas in the weeks following the end of April, especially in the U.S., Brazil, Britain, Sweden and Russia. Furthermore, due to travel restrictions and disruptions, the arrivals from overseas during the January to April period is weighted heavily towards the beginning of that period. For example, more than nine times as many people entered Australia from China in January and February as they did in March and April; and similarly nearly ten times as many people entered Australia from Europe in the first two months of this year as in the subsequent two months. Yet, the first two months of this year were precisely when the coronavirus was spreading rapidly in China and had not yet begun its rampant spread through Europe; whereas in March and April, the virus was largely contained in China but spreading like wildfire in Europe.
Fortunately, we can actually compare the rate of infections of those entering Australia from China in January and February when the pandemic was worst there with the infection rate of those entering from Europe (and the Americas) in just the March and April period when the pandemic was worse there. Statements from Australian health officers indicate that there were 15 people who turned out to be infected with COVID-19 who arrived from China in January, although some of these people did not develop symptoms and become detected until early February [30]. And as noted earlier in this article, Australia’s Deputy Chief Medical Officer, Professor Paul Kelly, has informed us that none of the people who entered Australia from China in February were found to have COVID-19 [17]. Thus in January and February combined there were only 15 people who entered Australia from China infected with the coronavirus. Now the Australian Bureau of Statistics figures show that a total of 290,470 people entered Australia from China in January and February [27] [28]. Therefore, the proportion of people entering Australia from China who were coronavirus-infected during the first two months of this year, the worst months of the pandemic there, was 0.0052% or 52 cases per million people. The Department of Health’s pie chart [20] showing that, up to 30 April, 34% of the overseas acquired COVID-19 cases came from Europe combined with the fact that there were (as shown earlier in this article) 4,295 cases from abroad by April 30, demonstrates that, up to the end of April, 1,460 virus-infected people entered Australia from Europe. Statements by Australia’s minister of health and health officials in early March indicated that up to then none of the COVID-19 cases detected in Australia came from arrivals from Europe [31]. To be sure, this does not mean that there were not any coronavirus-infected people who entered Australia from Europe in January and February. People who entered Australia from Europe in this period and became ill were neither tested nor asked to be tested. So even if they actually had COVID-19 they were not detected and thus not included in Australian government figures. Therefore, all the 1,460 COVID-19 cases listed by Australian government data as having arrived from Europe up to 30 April came to Australia in either March or April. Noting that there were in total 147,490 residents and visitors arriving into Australia from Europe in March and April [27] [28], then the proportion of arrivals into Australia from Europe who were infected with COVID-19 in March and April was 0.9899% or 9,899 cases per million people. That is a massive 190 times greater than the proportion of people arriving from China who were infected with COVID-19 during the worst two months of the pandemic in China! Note this is what Australian government data is saying.
Given that the rate of infection of people entering from a country is a strong indicator of the extent of the virus spread in that country itself, we can say in summary that the Australian government’s own data confirms what the WHO and most serious infection disease specialists – and indeed ostracised NSW Labor MP Shaoquett Moselmane – have said: that the Peoples Republic of China has been incredibly successful in containing the COVID-19 outbreak.
Australian Regime Hides Embarrassing Data
As we pointed out earlier in this article, the Australian government’s Department of Health had been publishing daily on its website that pie chart titled, “Australian confirmed cases who acquired COVID-19 overseas, by region.” However from April 30, without explanation, the Australian government agency stopped publishing this data. For a few days after this, the pie chart could still be found, with considerable difficulty, through doing a search on the Department of Health’s website. We saved the exact link to this pie chart (which at the time of writing still works) and saved the screenshot. However, soon after, the pie chart stopped appearing even on a search on that Australian government department’s website. The chart has been simply obliterated from the department’s search database! Moreover, one cannot find the latest version of this infographic even through a Google search with the name of the infographic as the search term.
As we explained above, you can only find the latest (i.e. April 30) version of the chart if you type in its exact web address. But you will only know that address if you had saved the exact address of the infographic previously! In other words, nearly everyone now trying to find this pie chart, “Australian confirmed cases who acquired COVID-19 overseas, by region,” will not be successful in accessing this data online. Is this the kind of “transparency” that Marise Payne is talking about! Today, if one does a Google search with the name of the chart as the search term, one can only find a small number of earlier versions of the chart (i.e. before April 30) with old data. In these search results, older versions of the chart that had been previously screenshot by a media outlet are reproduced: like this earlier version of the chart that was shown on the 7 News website with data up to March 30: https://7news.com.au/lifestyle/health-wellbeing/coronavirus-australia-the-latest-cases-and-trends-c-770380 [32]. Australian regime officials have well and truly “disappeared” from cyberspace their own pie chart showing the breakdown in regions from where COVID-19 cases entered Australia from overseas.
Now why would Australian officials want to hide their own infographic that for weeks they had been showing us daily? Well the date that they last showed the graph, April 30, is telling. This was when the U.S. and Australian government’s witch-hunt against socialistic China over the coronavirus outbreak was at its height. It was within two weeks of Australia’s home affairs minister Peter Dutton demanding “transparency from China” in the context of lending credence to the nutcase far-right conspiracy “theory” that the coronavirus was leaked out of a Chinese lab; followed by foreign minister, Marise Payne, calling for a witch-hunting “inquiry” into the origins of COVID-19 after having already blamed China for the outbreak and then ratcheting up her attack further by calling for the “inquiry” to have weapons inspectors-like powers (thus associating the proposed “inquiry” with the “inspections” that paved the way for the 2003 invasion of Iraq). However, the entire premise of this anti-PRC witch-hunt and the claim that the proposed “inquiry” is in Australia’s “national interest” (there is actually no such thing as “national interest” – there is only the interests of Australia’s capitalist exploiting class and the counterposed interests of Australia’s working class, the latter being synonymous with the interests of workers of the world), is blown apart by the reality that only a tiny proportion of the imported COVID-19 cases came into Australia from China. The overwhelming majority of cases that entered Australia from overseas came from Europe and America and from cruise ships. This truth then illustrates that the focus of investigating how the virus came into Australia should not be about the “origins” of the virus – and it has not even been definitely established that the virus “originated” in China – and its first known spread within China but rather on why governments in Europe and America failed so miserably to contain the virus; and on why the Australian government allowed large numbers of people to enter with the virus from Europe, America and cruise ships without proper screening even while they barred non-citizens from China (and later Iran and South Korea) from entry altogether. In other words the infographic, “Australian confirmed cases who acquired COVID-19 overseas, by region” that the Australian government’s Department of Health had once been publishing daily, both blew apart the Washington-Canberra attacks against China over the coronavirus outbreak and exposed the serious flaws in the Australian government’s own handling of the pandemic. That is almost certainly why the Australian regime has decided to not only stop publishing this infographic daily but, moreover, then totally obliterate their own infographic from their own website’s archival searches. Talk about “authoritarian”!
Regrettably, we will never know for sure the Australian regime’s reasons for disappearing this embarrassing pie chart and just who ordered it unless someone comes forward as a whistle blower. However, many Australian public health officials who might be wanting to expose this blatant attack on the professional integrity of their work would know that whistle blowers are fiercely repressed by the Australian regime. They may well be aware of the Australian regime’s severe prosecutions going on against whistle blowers Bernard Collaery, “Witness K” and David McBride that could see these people jailed for long periods. Moreover, any one thinking of being a whistle blower or an exposer of Australian regime corruption must look on in trepidation as they see the way that the Australian government has been complicit in the American and British regime’s cruel persecution of Julian Assange.
Nevertheless, despite all this repression going on, we call on anyone with a strong conscience working in Australia’s Department of Health to risk their careers and blow the whistle on why, how, on whose orders and over whose objections, the Department of Health stopped publishing and then “disappeared” from its search database its own, formerly daily, infographic on the sources of COVID-19 cases acquired overseas. We ask such people to be inspired by those in the U.S. who have blown the whistle on the manipulation of COVID-19 data by states seeking to justify re-opening: like Rebekah Jones of the Florida Department of Public Health who for the sake of Florida’s people – and humanity more generally – exposed how she had been ordered to “manually change data to drum up support for the plan to reopen” [5] [6]. If you follow in the footsteps of such courageous whistle blowers, history will not forget you and even if you face retribution for such brave deeds you can be sure in the knowledge that you are advancing humanity’s cause. You would be – in Marise Payne’s own words but in the exact opposite direction – countering efforts at disinformation “through facts and transparency.” Moreover, please remember that the Australian regime’s cover up of the fact that so few of the COVID-19 cases came from Asia is helping to fuel the horrific violence and abuse against Asian origin people in Australia under the guise of pandemic fears. By helping to expose this cover up you will be able to contribute to resisting rabid racist forces who are using the coronavirus outbreak to incite fear and hatred against Asians and other people of colour.
However, regardless of whether we do eventually find out for sure why the Australian government is now making it almost impossible to find its own infographic on the sources of overseas-acquired COVID-19 cases, the reality is that this data, alongside the fact that none of the 40,000 arrivals into Australia from China during the peak of the pandemic there in February were found to have COVID-19 and the fact that none of the 544 Australian residents brought out of Wuhan at the height of the outbreak there tested positive for COVID-19, all show how effectively the Peoples Republic of China has contained the virus threat. Moreover, this examination of the Australian government’s own data has completely demolished the whacko conspiracy “theory” that China has concealed the true extent of the COVID-19 impact there. All the insults thrown at NSW MP Shaoquett Moselmane for rightly praising China’s response to the pandemic can now be thrown back in the face of Ray Hadley and the other media personalities claiming that China has covered up the true toll of the outbreak there. It is Ray Hadley and his ilk who are the “imbeciles,” “jerks,” and “lunatics”! The false claim that “China has spread disinformation” by “greatly under-reporting its COVID-19 infection toll” turns out to be the only actual disinformation that is going on. It is the U.S. and Australian capitalist ruling classes and their media who are the ones guilty of spreading disinformation around COVID-19. As for “transparency”: try finding the Australian government’s latest data on sources of overseas-acquired COVID-19 cases that they had previously themselves published (without using the direct web address that we have given you)!

Photo Credit: Xinhua/Fei Maohua
References
- Lily Kuo, Beijing lockdown tightens as new coronavirus outbreak spreads, The Guardian Australian edition website, 15 June 2020, https://www.theguardian.com/world/2020/jun/15/beijing-lockdown-tightens-as-new-coronavirus-outbreak-spreads
- Tom Daly and Xiao Han, Beijing tests food and parcel couriers as coronavirus checks widen, Reuters website, 20 June 2020, https://www.reuters.com/article/us-health-coronavirus-china/beijing-tests-food-and-parcel-couriers-as-coronavirus-checks-widen-idUSKBN23R06P
- Australian Government Department of Health , Coronavirus (COVID-19) at a glance – 19 June 2020, Australian Government Department of Health website, https://www.health.gov.au/sites/default/files/documents/2020/06/coronavirus-covid-19-at-a-glance-19-june-2020.pdf
- Ken Bredemeier, US COVID Death Toll ‘Almost Certainly Higher’ Than Reported, Fauci Tells Senate, VOA (Voice of America) website, 13 May 2020, https://www.voanews.com/usa/us-covid-death-toll-almost-certainly-higher-reported-fauci-tells-senate
- Dan Vergano, Scientists Studying The Coronavirus Say Some States Are Censoring Them, BuzzFeed News website, 20 May 2020, https://www.buzzfeednews.com/article/danvergano/florida-arizona-georgia-coronavirus-data-censorship
- Theresa Waldrop, Rosa Flores and Joe Sutton, Florida and Georgia facing scrutiny for their Covid-19 data reporting, CNN website, 20 May 2020, https://edition.cnn.com/2020/05/20/us/florida-georgia-covid-19-test-data/index.html
- Paul Osborne, Latest facts and figures on coronavirus, Newcastle and Lake Macquarie Star website (article from Australian Associated Press), 18 February 2020, https://www.newcastlestar.com.au/story/6635405/latest-facts-and-figures-on-coronavirus/
- Robyn Wuth, Coronavirus update: Six Australians evacuated from Diamond Princess test positive for the deadly virus, AAP/7 News, 22 February 2020, https://7news.com.au/travel/coronavirus/coronavirus-updates-six-australians-evacuated-from-diamond-princess-test-positive-for-the-deadly-virus-c-710890
- Ray Hadley, Ray Hadley call on NSW Labor MP Shaoquett Moselmane to resign, OnmyStudio website, 2 April 2020, https://omny.fm/shows/the-ray-hadley-morning-show/ray-hadley-call-on-nsw-labor-mp-shaoquett-moselman
- BBC, Coronavirus: More than 200 Australians flown home after 14-day quarantine, BBC News website, 17 February 2020, https://www.bbc.com/news/world-australia-51538711
- Greg Roberts, Cruise ship Australians arrive in Darwin, Illawara Mercury website, 22 February 2020, https://www.illawarramercury.com.au/story/6639684/cruise-ship-australians-arrive-in-darwin/?cs=12
- Australian Government Department of Health, Chief Medical Officer press conference on novel coronavirus, Australian Government Department of Health website, 23 February 2020, https://www.health.gov.au/news/chief-medical-officer-press-conference-on-novel-coronavirus
- Australian Government Department of Health, Two Diamond Princess passengers positive for COVID-19, Australian Government Department of Health website, 21 February 2020, https://www.health.gov.au/news/two-diamond-princess-passengers-positive-for-covid-19
- Jake Sturmer and Yumi Asada, Coronavirus quarantine finally ends for Australians on Diamond Princess, but isolation in Darwin awaits, ABC News website, 20 February 2020, https://www.abc.net.au/news/2020-02-20/thousands-finally-free-to-leave-coronavirus-cruise-ship/11981018
- The New Daily, Aussies rescued from virus-stricken cruise ship arrive in Darwin, The New Daily website, 20 February 2020, https://thenewdaily.com.au/news/national/2020/02/20/diamond-princess-evacuation-darwin/
- SBS, Coronavirus-hit cruise ship evacuees allowed to leave quarantine near Darwin, SBS News website, 6 March 2020, https://www.sbs.com.au/news/coronavirus-hit-cruise-ship-evacuees-allowed-to-leave-quarantine-near-darwin
- Australian Government Department of Health, Deputy Chief Medical Officer’s interview on ABC Radio National about coronavirus (COVID-19), Australian Government Department of Health website, 28 February 2020, https://www.health.gov.au/news/deputy-chief-medical-officers-interview-on-abc-radio-national-about-coronavirus-covid-19
- Australian Government Department of Health, Deputy Chief Medical Officer’s press conference about COVID-19 on 16 March, Australian Government Department of Health website, 16 March 2020, https://www.health.gov.au/news/deputy-chief-medical-officers-press-conference-about-covid-19-on-16-march
- Australian Government Department of Health, Coronavirus (COVID-19) at a glance – 12 April 2020, Australian Government Department of Health website, 12 April 2020, https://www.health.gov.au/resources/publications/coronavirus-covid-19-at-a-glance-12-april-2020
- Australian Government Department of Health, Australian confirmed cases who acquired COVID-19 overseas, by region, 30 April 2020, https://www.health.gov.au/sites/default/files/images/publications/2020/04/covid-19-cases-acquired-overseas-by-region-or-country-acquired_29.png (accessed 18 June 2020)
- Australian Government Department of Health, Coronavirus (COVID-19) at a glance, Australian Government Department of Health website, 30 April 2020, https://www.health.gov.au/sites/default/files/documents/2020/04/coronavirus-covid-19-at-a-glance-30-april-2020.pdf (accessed 25 May 2020)
- Melissa Davey, Coronavirus: two more cases in NSW after residents return from Japan and South Korea, The Guardian website, 3 March 2020, https://www.theguardian.com/world/2020/mar/03/coronavirus-two-more-cases-in-nsw-after-residents-return-from-japan-and-south-korea
- Emily Olle, Two new coronavirus cases emerge in SA, including a baby, 7 News website, 5 March 2020, https://7news.com.au/lifestyle/health-wellbeing/coronavirus-sa-two-new-cases-including-a-baby-test-positive-c-730972
- AAP-SBS, Sydney coronavirus cluster investigated as NSW cases jump to 55, SBS website, 10 March 2020, https://www.sbs.com.au/news/sydney-coronavirus-cluster-investigated-as-nsw-cases-jump-to-55
- NSW Government Health, Recent flights with confirmed cases of COVID-19, NSW Health website, https://www.health.nsw.gov.au/Infectious/covid-19/Pages/flights.aspx (accessed 25 May 2020)
- NSW Government Health, Other known flights with confirmed cases of COVID-19, NSW Health website, https://www.health.nsw.gov.au/Infectious/covid-19/Pages/flights-archive.aspx#nsw-int (accessed 25 May 2020)
- Australian Bureau of Statistics, 3401.0 – Overseas Arrivals and Departures, Australia, Apr 2020 (download Table 5), Australian Bureau of Statistics website, https://www.abs.gov.au/AUSSTATS/abs@.nsf/DetailsPage/3401.0Apr%202020?OpenDocument (accessed 18 June 2020)
- Australian Bureau of Statistics, 3401.0 – Overseas Arrivals and Departures, Australia, Apr 2020 (download Table 9), Australian Bureau of Statistics website, https://www.abs.gov.au/AUSSTATS/abs@.nsf/DetailsPage/3401.0Apr%202020?OpenDocument (accessed 18 June 2020)
- Worldometers, Australia Coronavirus Cases, https://www.worldometers.info/coronavirus/country/australia/ (accessed 22 May 2020)
- Australian Government Department of Health, Deputy Chief Medical Officer press conference: update on novel coronavirus, Australian Government Department of Health website, 8 February 2020,
https://www.health.gov.au/news/deputy-chief-medical-officer-press-conference-update-on-novel-coronavirus - Australian Government Department of Health, Chief Medical Officer and Minister Hunt’s joint press conference on coronavirus (COVID-19), Australian Government Department of Health website, 3 March 2020,
https://www.health.gov.au/news/chief-medical-officer-and-minister-hunts-joint-press-conference-on-coronavirus-covid-19 - Allie Godfrey, Coronavirus Australia: The latest cases and trends, 7 News website, 30 March 2020, https://7news.com.au/lifestyle/health-wellbeing/coronavirus-australia-the-latest-cases-and-trends-c-770380